![]()
![]()
![]()
Reading for Today's Lecture:
Outline of Today's Lecture:
Today's notes
The Central Limit Theorem
If
![]() are iid with mean 0 and variance 1 then
are iid with mean 0 and variance 1 then
![]() converges in distribution to N(0,1). That is,
converges in distribution to N(0,1). That is,
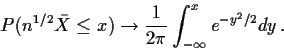
Proof: Let m(t) be the moment generating function
of an individual X. Then
![\begin{align*}E(e^{tn^{1/2}\bar{X}})& = \text{E}(e^{tn^{-1/2}(X_1+\cdots+X_n)}
\...
...t^3 m^{\prime
\prime \prime}(\theta)/6\right]^n
\\
& \to e^{t^2/2}
\end{align*}](img5.gif)
This is the moment generating function of a N(0,1) random variable so
we are done by our theorem. Notice in the proof that we are using
a specific form of the remainder term in Taylor's theorem and that we
are using the fact that if ![]() then
then
The next section of material is extra. Go to rest of lecture
Remarks:
Multivariate convergence in distribution
Definition:
![]() converges in distribution to
converges in distribution to ![]() if
if
This is equivalent to either of
Cramér Wold Device:
atXn converges in distribution to at X for each ![]()
or
Convergence of Characteristic Functions:
Extensions of the CLT
Slutsky's Theorem: If Xn converges in distribution to Xand Yn converges in distribution (or in probability) to c, a constant, then Xn+Yn converges in distribution to X+c.
Warning: the hypothesis that the limit of Yn be constant is essential.
The delta method:
Suppose a sequence Yn of random variables converges to some y a
constant and that if we define
Xn = an(Yn-y) then Xn converges in
distribution to some random variable X. Suppose that f is a
differentiable function on the range of Yn.
Then
an(f(Yn)-f(y)) converges in distribution to
![]() .
If
Xn is in Rp and f maps Rp to Rq then
.
If
Xn is in Rp and f maps Rp to Rq then ![]() is the
is the
![]() matrix of first derivatives of components of f.
matrix of first derivatives of components of f.
Example: Suppose
![]() are a sample from a population with
mean
are a sample from a population with
mean ![]() ,
variance
,
variance ![]() ,
and third and fourth central moments
,
and third and fourth central moments
![]() and
and ![]() .
Then
.
Then
We take Yn to be the vector with components
![]() .
Then Yn converges to
.
Then Yn converges to
![]() .
Take
an = n1/2. Then
.
Take
an = n1/2. Then
![\begin{displaymath}\Sigma = \left[\begin{array}{cc} \mu_4-\sigma^4 & \mu_3 -\mu(...
...2)\\
\mu_3-\mu(\mu^2+\sigma^2) & \sigma^2 \end{array} \right]
\end{displaymath}](img38.gif)
![\begin{displaymath}n^{1/2}(s^2-\sigma^2) \approx n^{1/2}(1, -2\mu)\left[\begin{a...
...{X^2} -
(\mu^2 + \sigma^2)
\\
\bar{X} -\mu
\end{array}\right]
\end{displaymath}](img39.gif)
Remark: In this sort of problem it is best to learn to recognize that the
sample variance is unaffected by subtracting ![]() from each X. Thus
there is no loss in assuming
from each X. Thus
there is no loss in assuming ![]() which simplifies
which simplifies ![]() and a.
and a.
Special case: if the observations are
![]() then
then ![]() and
and
![]() .
Our calculation has
.
Our calculation has
The next section of material is extra. Go to rest of lecture
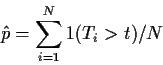
Monte Carlo
The last method of distribution theory that I will review is Monte Carlo
simulation. Suppose you have some random variables
![]() whose joint distribution is specified and a statistic
whose joint distribution is specified and a statistic
![]() whose distribution you want to know. To compute
something like P(T > t) for some specific value of t we appeal to the
limiting relative frequency interpretation of probability: P(T>t) is the
limit of the proportion of trials in a long sequence of trials in which Toccurs. We use a (pseudo) random number generator to generate a sample
whose distribution you want to know. To compute
something like P(T > t) for some specific value of t we appeal to the
limiting relative frequency interpretation of probability: P(T>t) is the
limit of the proportion of trials in a long sequence of trials in which Toccurs. We use a (pseudo) random number generator to generate a sample
![]() and then calculate the statistic getting T1. Then we
generate a new sample (independently of our first, say) and calculate
T2. We repeat this a large number of times say N and just count up
how many of the Tk are larger than t. If there are M such Tkwe estimate that
P(T>t) =M/N.
and then calculate the statistic getting T1. Then we
generate a new sample (independently of our first, say) and calculate
T2. We repeat this a large number of times say N and just count up
how many of the Tk are larger than t. If there are M such Tkwe estimate that
P(T>t) =M/N.
The quantity M has a Binomial( N,p=P(T>t)) distribution. The standard error of M/N is then p(1-p)/N which is estimated by M(N-M)/N3. This permits us to guess the accuracy of our study.
Notice that the standard deviation of M/N is
![]() so
that to improve the accuracy by a factor of 2 requires 4 times as many
samples. This makes Monte Carlo a relatively time consuming method of
calculation. There are a number of tricks to make the method more accurate
(though they only change the constant of proportionality - the SE is still
inversely proportional to the square root of the sample size).
so
that to improve the accuracy by a factor of 2 requires 4 times as many
samples. This makes Monte Carlo a relatively time consuming method of
calculation. There are a number of tricks to make the method more accurate
(though they only change the constant of proportionality - the SE is still
inversely proportional to the square root of the sample size).
Most computer languages have a facility for generating pseudo uniform random numbers, that is, variables U which have (approximately of course) a Uniform[0,1] distribution. Other distributions are generated by transformation:
Exponential: ![]() has an exponential distribution:
has an exponential distribution:
Normal: In general if F is a continuous cdf and U is
Uniform[0,1] then
Y=F-1(U) has cdf F because
Acceptance Rejection
If you can't easily calculate F-1 but you know f you can
try the acceptance rejection method. Find a density g and a constant
c such that
![]() for each x and G-1 is computable
or you otherwise know how to generate observations
for each x and G-1 is computable
or you otherwise know how to generate observations
![]() independently from g. Generate W1. Compute
independently from g. Generate W1. Compute
![]() .
Generate a uniform[0,1] random variable U1 independent of all
the Ws and let Y=W1 if
.
Generate a uniform[0,1] random variable U1 independent of all
the Ws and let Y=W1 if ![]() .
Otherwise get a new W and a
new U and repeat until you find a
.
Otherwise get a new W and a
new U and repeat until you find a
![]() .
You
make Y be the last W you generated. This Y has density f.
.
You
make Y be the last W you generated. This Y has density f.
Markov Chain Monte Carlo
In the last 10 years the following tactic has become popular, particularly
for generating multivariate observations. If
![]() is an
(ergodic) Markov chain with stationary transitions and the stationary
initial distribution of W has density f then you can get random
variables which have the marginal density f by starting off the Markov
chain and letting it run for a long time. The marginal distributions
of the Wi converge to f. So you can estimate things like
is an
(ergodic) Markov chain with stationary transitions and the stationary
initial distribution of W has density f then you can get random
variables which have the marginal density f by starting off the Markov
chain and letting it run for a long time. The marginal distributions
of the Wi converge to f. So you can estimate things like
![]() by computing the fraction of the Wi which land in
A.
by computing the fraction of the Wi which land in
A.
There are now many versions of this technique including Gibbs Sampling and the Metropolis-Hastings algorithm. (The technique was invented in the 1950s by physicists: Metropolis et al. One of the authors of the paper was Edward Teller ``father of the hydrogen bomb''.)
Importance Sampling
If you want to compute
![\begin{align*}E(\hat\theta) &= n^{-1} \sum E(T(X_i) f(X_i)/g(X_i)
\\
& = \int [T(x) f(x)/g(x)] g(x) dx
\\
& = \int T(x) f(x) dx
\\
& = \theta
\end{align*}](img80.gif)
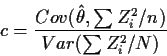
Variance reduction
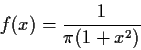
Consider the problem of estimating the distribution of the sample mean
for a Cauchy random variable.
The Cauchy density is
We can improve this estimate by remembering that -Xi also
has Cauchy distribution. Take Si=-Ti. Remember that Si has
the same distribution as Ti. Then we try (for t>0)
![\begin{displaymath}\tilde p = [\sum_{i=1}^N 1(T_i > t) + \sum_{i=1}^N 1(S_i > t) ]/(2N)
\end{displaymath}](img87.gif)
Regression estimates
Suppose we want to compute
Definition: A model is a family
![]() of possible distributions for some random variable X. (Our
data set is X, so X will generally be a big vector or matrix or even
more complicated object.)
of possible distributions for some random variable X. (Our
data set is X, so X will generally be a big vector or matrix or even
more complicated object.)
We will assume throughout this course that the true distribution P of Xis in fact some
![]() for some
for some
![]() .
We call
.
We call
![]() the true value of the parameter. Notice that this assumption
will be wrong; we hope it is not wrong in an important way. If we are very
worried that it is wrong we enlarge our model putting in more distributions
and making
the true value of the parameter. Notice that this assumption
will be wrong; we hope it is not wrong in an important way. If we are very
worried that it is wrong we enlarge our model putting in more distributions
and making ![]() bigger.
bigger.
Our goal is to observe the value of X and then guess ![]() or some
property of
or some
property of ![]() .
We will consider the following classic mathematical
versions of this:
.
We will consider the following classic mathematical
versions of this:
There are several schools of statistical thinking with different views on how these problems should be done. The main schools of thought may be summarized roughly as follows:
For the next several weeks we do only the Neyman Pearson approach, though we use that approach to evaluate the quality of likelihood methods.